GW151226: the second confirmed detection
On June 15, 2016, the LIGO Scientific Collaboration and Virgo collaboration announced the second confirmed detection of gravitational waves from the merger of two black holes. This is an exciting confirmation of LIGO's ability to detect these mergers. Here are some of the key facts from this discovery.
Key Facts about GW151226
More information:
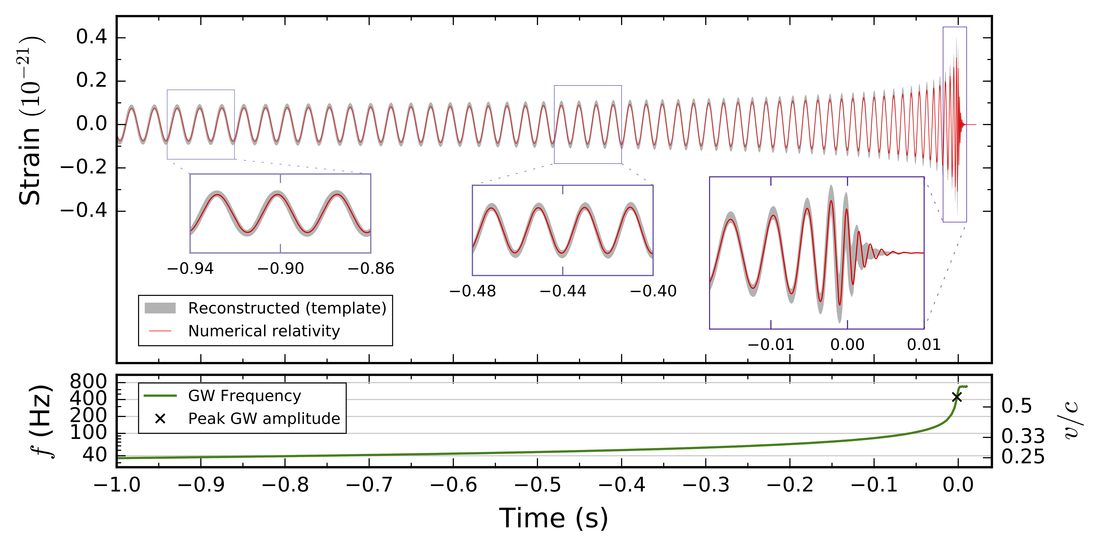
This lovely animation from the SXS numerical relativity group shows the inspiral and merger of GW151226, along with corresponding gravitational-wave signal as a function of time. The lower panel shows how the frequency and relative orbital speed increase with time. See also the SXS youtube channel for more great videos.
Key Facts about GW151226
- The signal was detected on December 26, 2015 03:38:53 UTC and is hence named GW151226. This time corresponds to 09:38:53pm Central Time on December 25th at the Livingston detector. A consistent signal was detected 1.1ms later at the Hanford detector.
- The gravitational waves were produced by two black holes with masses of about 14 and 8 solar masses. They merged to produce a single black hole with a mass of 21 solar masses. About one solar mass was released in gravitational-wave energy.
- The signal originated about 1.4 billion light years away. It was detected with a significance of over 5 sigma (the same level of significance as GW150914).
- Although the distance of GW151226 was similar to GW150914 (the first detection), the signal amplitude was about a factor of 3 weaker because the total mass was a factor of 3 smaller. Because of this GW151226 was not strongly visible in the filtered data. The technique of matched filtering was essential to finding this event in the LIGO detector output. We expect this to be the norm for most of the events that LIGO will see in the future (although we hope to see more really loud events like GW150914).
- Although the signal amplitude was about a factor of 3 weaker, there were about 55 observed wave cycles for this event (only 8 cycles were observed for GW150914). More wave cycles increase our ability to detect these signals and allow us to probe the physics of the inspiral part of the coalescence (along with the merger).
- Along with GW150914, an analysis of the signal from GW151226 shows good agreement with Einstein's theory of general relativity.
- The first observing run (O1) of Advanced LIGO ran from September 12, 2015 to January 19, 2016. During that time the detectors accumulated about 49 days of clean data with both detectors operating simultaneously. Three gravitational wave events were identified during that time period: two confirmed detections (GW150914 and GW151226) and an event candidate (LVT151012; LVT stands for "LIGO-Virgo Trigger"). The later was detected with much less significance and is not a confirmed gravitational-wave source; however, there is an estimated 86% probability that the signal is from a real astrophysical event (as opposed to noise). (For the confirmed detections, this probability is at least 99.9999%.)
More information:
- Caltech discovery announcement page
- Caltech media resources page (with images and animations)
- Announcement page at ligo.caltech.edu
- Science summary for GW151226
- Discovery paper on GW151226 at Physical Review Letters and companion Physics Focus article.
- Technical paper on the all binary black hole events from Advanced LIGO's first observing run.
- Fact sheet on GW151226.
- Video of press conference announcing the second detection.
- LIGO Open Science Center (LOSC) site for GW151226.
- Soundsofspacetime detection page for GW150914 with links to more resources on that first event.
This lovely animation from the SXS numerical relativity group shows the inspiral and merger of GW151226, along with corresponding gravitational-wave signal as a function of time. The lower panel shows how the frequency and relative orbital speed increase with time. See also the SXS youtube channel for more great videos.
"Sounds" from GW151226
Unlike the case of GW150914, one cannot easily see GW151226 by taking the LIGO data and applying a filter. (See discussion at our GW150914 page.) For that reason we start by showing the reconstructed waveform as presented in the discovery paper, followed by the corresponding sound:

Figure 5 from the discovery paper in Physical Review Letters. The top panel shows the (unfiltered) gravitational-wave signal in the Livingston detector. This is produced via a numerical relativity simulation. The gray bands show a range of waveforms that agree with the data at the 90% confidence level. The bottom panel shows the evolution of the gravitational-wave frequency and relative orbital speed as a function of time (as the inspiral/merger proceeds).
The following is the audio of the above signal, but starting at a slightly lower frequency (30Hz) than the detector was sensitive to. Headphones or speakers with a subwoofer are recommended to fully appreciate the sound. The sound is played in stereo at the actual frequency and duration of the real signal. The Livingston signal plays in the right ear and the Hanford signal in the left. The time offset between the two signals corresponds to the actual 1.1ms time delay. The sound will repeat once (you will hear two chirps, which are the same signal replayed once).
The sound above might be difficult to hear in detail. Caltech and LIGO lab have created a frequency-shifted version, which plays along with a time-frequency plot showing the "chirp" signal from GW151226. The video below plays sounds from both GW150914 and GW151226, first at their natural frequencies and then shifted to higher frequency. The colors show the amount of signal power at the corresponding frequency and time. The upward curving colored "path" that evolves in the plot is characteristic of the "chirping" nature of inspiraling compact binaries.
"Sounds" from all events in Advanced LIGO's first observing run
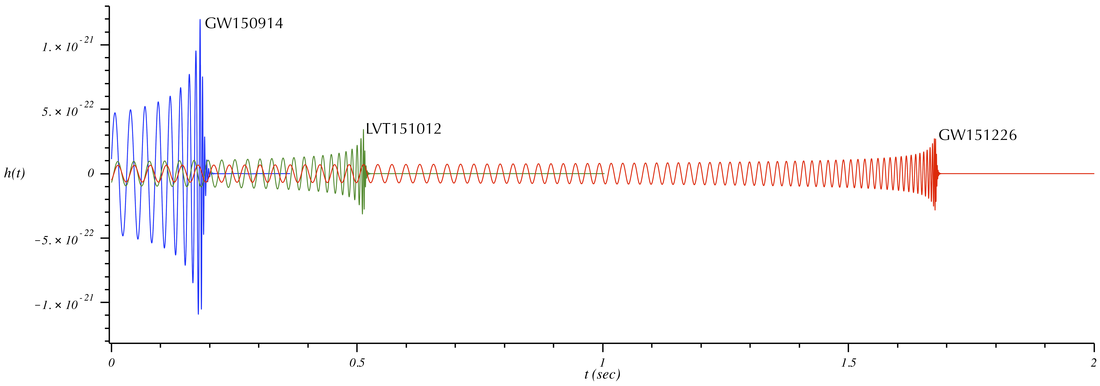
As discussed above, Advanced LIGO's first observation period ran from mid-September 2015 to mid-January 2016, netting ~49 days of clean simultaneous data from both detectors. Over that period three events of interest were found: two confirmed detections at >5 sigma confidence (GW150914 and GW151226) and one event candidate LVT151012 (found at lower significance, 1.7 sigma). Below we show a plot of the signal template in the Hanford detector for each of these three events. To give a sense of the intrinsic duration of each signal, we plot the template from 30Hz to the merger. (The actual signals were detected at frequencies starting a bit higher than 30Hz, where the detector noise is lower.) The sounds of the three signals are below the graphs. Listen to them in the order presented (GW150914, LVT151012, GW151226). Notice how the lower mass signals are longer in duration and evolve to higher frequencies.

Best-fit theoretical template in the Hanford detector signal for the three loudest events in Advanced LIGO's first observing run. The time axis indicates the signal duration from 30 Hz; the vertical axis shows the strain amplitude (strength of the gravitational-wave signal). (This plot was produced via data from a spinning but non-precessing effective-one-body/SEOB waveform model. It is similar to data shown in Figure 1 of the O1 BBH paper linked to above. Unlike similar plots for GW150914 shown elsewhere, the Hanford signal was not inverted above, but it was inverted when creating the audio files below.)
You can find more "sounds" from GW151226 and the other sources at the LOSC data release website. See also their excellent tutorials.
A comparison of black hole sizes
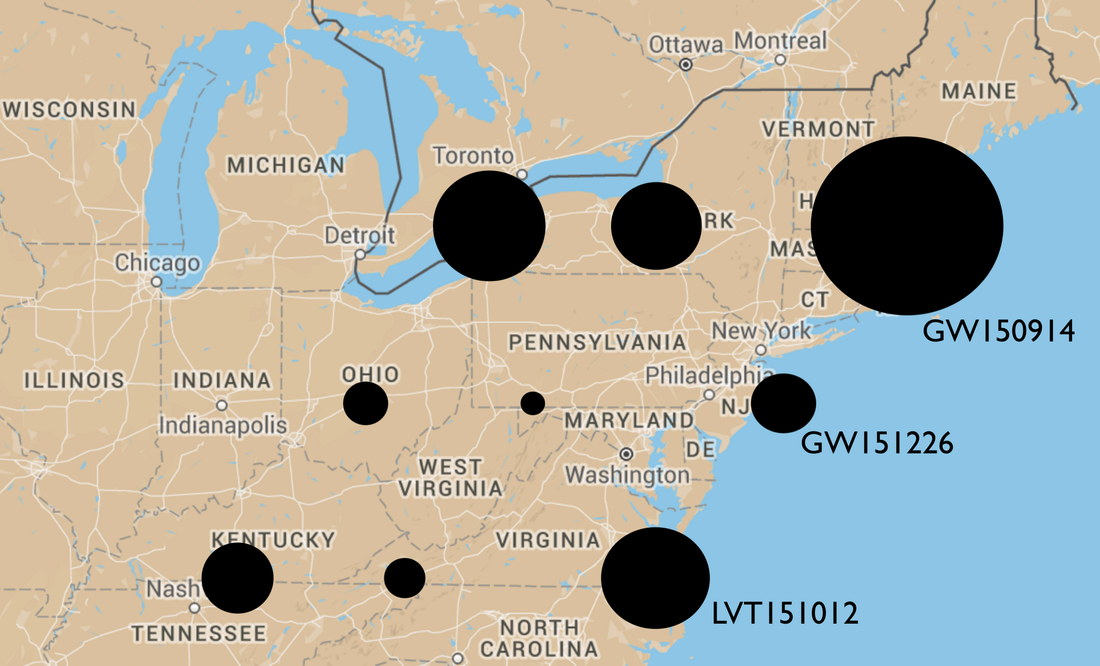
It is interesting to compare properties of LIGO's three gravitational-wave events. We first start with a comparison of the black hole sizes. In the image below we plot the size of each black hole against a map of the US east coast. Each "row" contains three black holes: the left two are the pre-merger black holes and right-most larger black hole is the merger remnant. The "width" of each black hole is computed from the circumference of a Kerr (spinning) black hole (and dividing by pi). The "shape" of each hole is an oval because the event horizon bulges outward at low latitudes. (This figure uses the median values for the black hole masses and spins reported in Table IV of O1 BBH paper.)
See also this very nice diagram showing all known black holes observed with both gravitational-waves and electromagnetic waves.
Sky localization
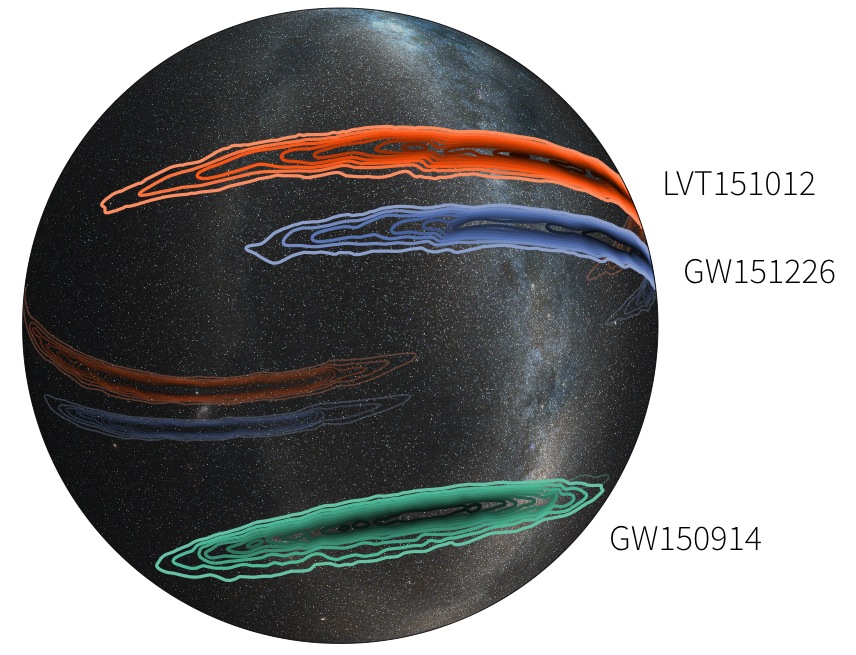
In the image below you can see the sky areas to which each of the three events have been localized. Gravitational-wave detectors have rather poor sky localization as compared with electromagnetic telescopes. Of the three events, GW150914 had the "best" localization, corresponding to 230 square degrees (or 1150 times the sky area of the full Moon). GW151226 had the second-best localization, corresponding to 850 square degrees (4250 times the sky area of the full moon). For LVT151012 the sky localization area was 1600 square degrees (8000 times the full Moon's angular area).

Sky map showing a three-dimensional projection of the Milky Way onto a transparent globe, along with the probable locations of the three LIGO events. The outer contour represents the 90 percent confidence region; the innermost contour signifies the 10 percent confidence region.
Credit: LIGO (Leo Singer) /Milky Way image (Axel Mellinger)
You can further explore the angular location of GW151226 via this interactive skymap from the LOSC's Skymap Viewer or via the Gravoscope site.


